EVM
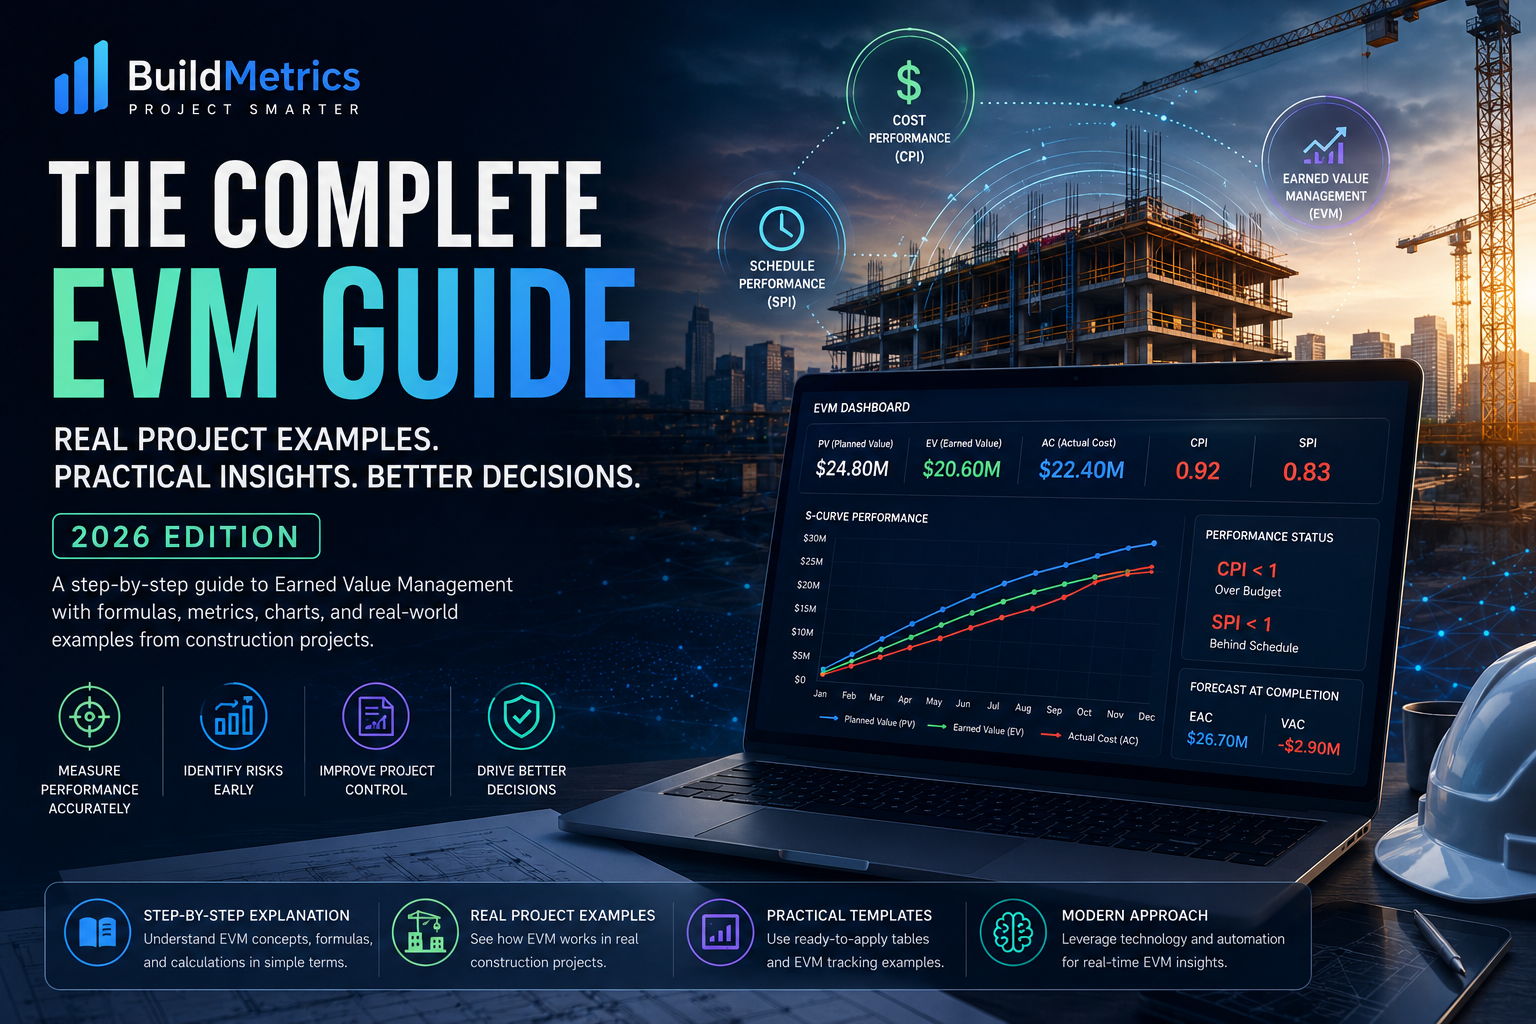
Earned Value Management (EVM): Full Guide with Real Project Examples (2026)
By Ahmed Elsamahy • • 12 min read
Most projects do not fail suddenly. They fail gradually. At first: Progress reports look acceptable Teams say everything is under control Dashboards appear “green” Stakeholders feel comfortable But underneath the surface: Productivity is dropping Costs are rising faster than progress Procurement is slipping Delays are quietly accumulating And by the time management realizes the problem: 👉 Recovery becomes extremely difficult. This is exactly why Earned Value Management (EVM) exists. EVM is not just a reporting method. It is one of the most powerful systems for measuring real project performance. When implemented correctly, EVM helps teams answer critical questions: Are we ahead or behind schedule? Are we spending efficiently? What will the final project cost likely become? Are current trends improving or deteriorating? How early can we detect project failure? In this guide, we will break down: What Earned Value Management actually means The core EVM formulas explained simply Real project examples Common mistakes teams make Why SPI and CPI can sometimes be misleading How modern project controls teams are evolving beyond Excel-based EVM reporting
What Is Earned Value Management (EVM)?
Earned Value Management (EVM) is a project performance management methodology that integrates: Scope Schedule Cost Into a single performance measurement system. The main goal of EVM is simple: 👉 Compare what was planned vs what was actually achieved. Instead of only tracking: Money spent Activities completed Schedule dates EVM combines everything together to reveal true project performance.
Why EVM Matters in Real Projects
Many projects still rely on basic progress updates. Example: “Project is 52% complete.” But that alone means almost nothing. Questions immediately arise: Was 52% planned? How much money was spent to achieve it? Is productivity improving or deteriorating? Is the project burning cash too fast? This is where EVM becomes critical. EVM transforms isolated numbers into performance intelligence.
The Three Core EVM Metrics
Everything in Earned Value Management revolves around three core values:
- Planned Value (PV)
Planned Value represents: 👉 How much work SHOULD have been completed by a certain date. It comes directly from the baseline schedule and approved budget. Example: If the project plan expected: 40% progress by Month 4 Total budget = $10M Then: PV = $4M
- Earned Value (EV)
Earned Value represents: 👉 The actual value of completed work. Example: If actual progress achieved is only 30%: EV = $3M This means: The project only “earned” $3M worth of planned work.
- Actual Cost (AC)
Actual Cost represents: 👉 The real money spent. Example: If the project already spent: AC = $4.2M Then the team spent $4.2M to achieve only $3M worth of work. That is a major warning signal.
The Most Important EVM Formulas
Schedule Variance (SV) Formula: SV = EV − PV Purpose: Measures schedule performance. Example: EV = $3M PV = $4M SV = -$1M Meaning: 👉 The project is behind schedule. Cost Variance (CV) Formula: CV = EV − AC Purpose: Measures cost efficiency. Example: EV = $3M AC = $4.2M CV = -$1.2M Meaning: 👉 The project is over budget. Schedule Performance Index (SPI) Formula: SPI = EV / PV Purpose: Measures schedule efficiency. Interpretation: SPI > 1 = ahead of schedule SPI = 1 = on schedule SPI < 1 = behind schedule Example: SPI = 3 / 4 = 0.75 Meaning: 👉 The project is progressing at only 75% of planned efficiency. Cost Performance Index (CPI) Formula: CPI = EV / AC Purpose: Measures cost efficiency. Interpretation: CPI > 1 = under budget CPI = 1 = on budget CPI < 1 = over budget Example: CPI = 3 / 4.2 = 0.71 Meaning: 👉 The project is spending inefficiently.
Real Project Example
Imagine a construction project with: BAC (Budget at Completion) = $50M Planned progress by Month 8 = 60% Actual progress achieved = 48% Actual cost spent = $32M Step 1 — Calculate PV PV = 60% × $50M PV = $30M Step 2 — Calculate EV EV = 48% × $50M EV = $24M Step 3 — Actual Cost AC = $32M Step 4 — Calculate SPI SPI = EV / PV SPI = 24 / 30 = 0.80 Meaning: 👉 The project is significantly behind schedule. Step 5 — Calculate CPI CPI = EV / AC CPI = 24 / 32 = 0.75 Meaning: 👉 The project is spending heavily for relatively low progress.
Why EVM Is So Powerful
The real power of EVM is early detection. Traditional reporting often discovers problems too late. EVM identifies performance deterioration early. Instead of waiting for project completion: Teams can detect: Productivity decline Cost inefficiency Delayed progress Forecasted overruns Months earlier.
The Biggest EVM Mistake Most Teams Make
One of the most dangerous problems in EVM is inaccurate progress measurement. If progress updates are inflated: 👉 All EVM calculations become misleading. Example: If the site team reports: 55% actual progress But reality is closer to: 45% Then: EV becomes artificially high SPI appears healthier CPI appears better Management receives false confidence This is extremely common in real projects.
Why SPI Can Sometimes Be Misleading
Many project teams assume: “SPI below 1 automatically means delay.” That is not always true. Example: Some activities may not be on the critical path Procurement delays may not yet impact execution Certain work fronts may be intentionally resequenced This is why EVM should NEVER be used alone. Strong project controls teams combine: EVM Critical path analysis Procurement tracking Productivity analysis Risk analysis Together.
Why Excel-Based EVM Reporting Is Becoming a Major Problem
Many PMOs still manage EVM entirely in Excel. The issue is not Excel itself. The issue is scale and complexity. Modern projects generate: Thousands of activities Frequent updates Massive cost datasets Multi-source reporting This creates: Manual reconciliation Delayed reporting Formula errors Version control problems Weak visibility And most importantly: 👉 Teams spend more time preparing reports than analyzing performance.
What Modern Project Controls Teams Are Doing Instead
Leading organizations are increasingly shifting toward: Automated EVM dashboards Real-time progress tracking AI-powered performance insights Integrated schedule/cost systems Executive-level reporting automation Instead of manually calculating: SPI CPI SV CV EAC Modern systems can generate these instantly.
The Role of AI in Earned Value Management
Artificial Intelligence is beginning to reshape project controls. Modern AI-powered systems can: Detect performance anomalies automatically Identify deteriorating trends Forecast likely overruns Generate executive summaries Highlight high-risk areas earlier The industry is slowly moving from: Reactive reporting → Predictive project intelligence.
A Better Approach to EVM
The strongest project teams today are not necessarily the teams with the most reports. They are the teams with: Faster visibility Better forecasting Cleaner data integration Faster decision-making This is why platforms like BuildMetrics AI are emerging. Instead of manually preparing EVM reports every cycle: Teams can: Upload project data directly Track SPI/CPI automatically Generate executive dashboards Monitor trends continuously Detect issues earlier
Final Thoughts
Earned Value Management remains one of the most powerful methodologies in project controls. But EVM only becomes valuable when: Progress data is reliable Reporting is timely Teams focus on trends Insights drive decisions Projects rarely collapse overnight. Most projects show warning signs months earlier. EVM helps teams detect those warning signs before they become critical.
Related Articles
Cost Control Best Practices in Construction Baseline Project Schedule: Step-by-Step Guide Executive Reporting Best Practices for Construction Projects How AI Is Transforming Project Controls
Ready to Move Beyond Manual EVM Reporting?
If your team is still calculating SPI and CPI manually in spreadsheets: 👉 Explore how BuildMetrics AI helps construction teams automate project performance tracking, executive reporting, and EVM analysis in real time.